In this piece: how to read any burnout figure in ten seconds, which of two fixes it points to, and the one survey item to change before your next cycle.
A deck in your inbox says 59% of Indian employees show burnout symptoms. A vendor has quoted you 83%. Your own survey says a third number. And a budget is due.
Pick the wrong figure and you buy the wrong thing: a resilience workshop for a team that needs a smaller workload, or a workload review for a team whose real problem is its manager. That mistake costs a year.
So which number is true? All of them. That's the problem.
Every survey uses a different ruler
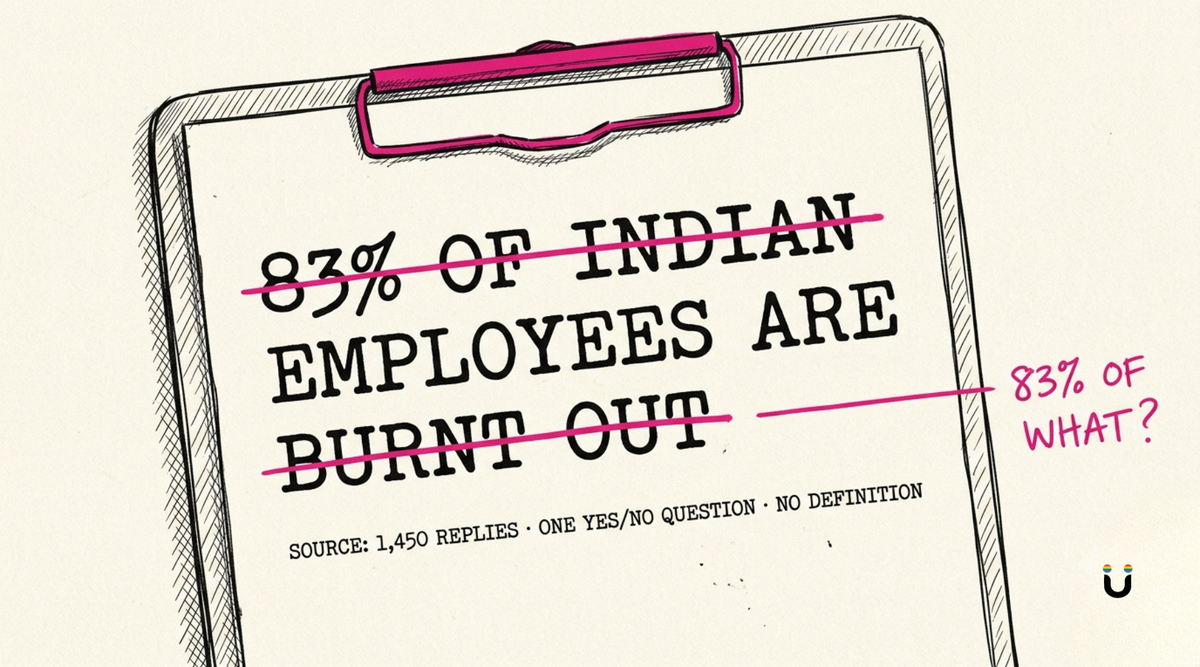
The WHO defines burnout in ICD-11 as an occupational phenomenon, not a disease: exhaustion, cynicism about the job, and reduced professional efficacy, all three, from chronic work stress. Almost no survey uses that definition. Each draws its own line and counts everyone above it. Each number tells you where the line was drawn before it tells you anything about the people above it. We call this the ruler problem.
The 83% is 1,450 IT professionals on Blind, an anonymous professional community app, answering one yes/no question with no definition and no time frame. It counts tired people who use the word.
The 59% is McKinsey's 30-country panel from 2023, four dimensions on a 1 to 5 scale, "symptoms" meaning an average of 3 or above. The midpoint. McKinsey kept the word "symptoms". The Indian press dropped it.
The 13% is Great Place To Work India's top band, from 5.7 million responses at companies that applied to be ranked among India's best employers. Large sample, not a random one.
The 13% hasn't moved since 2022, which looks like proof the money's working. But the same studies show discretionary effort down 4% since 2023 at 63% of organisations. People withdraw effort long before they hit exhaustion. The 13% didn't withdraw in time. The 63% are the queue.
Which burnout do you have?
Even a correct total hides the one thing you need in order to buy the right fix.
The job demands-resources model (Demerouti, Bakker and colleagues, 2001) found the two dimensions have different causes. Demands (hours, targets, ambiguity) produce exhaustion. Missing resources (autonomy, feedback, a manager who notices) produce cynicism. Exhaustion is a workload problem. Cynicism is a resources problem, usually a manager problem. A single percentage cannot tell you which one you are paying for.
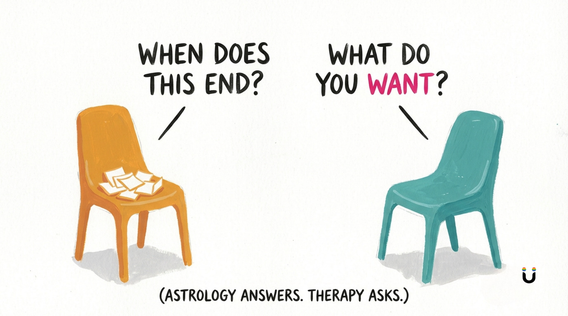
We see the same split in the room. People who arrive at our practice saying "burnout" are exhausted, yes. But what they describe is a growing weight of responsibility they cannot seem to fulfil, and a sense of no longer being aligned with the work, sometimes with themselves. They believe a break will fix it. It never does. A break isn't the question. The question is one nobody's asked them: what do you actually want?
They are mostly mid to senior managers. They lead teams doing work they loved, and seldom get to do it. The day is firefighting, coordinating, delegating. Founders, by contrast, come in anxious far more often than burnt out. They set the deadlines, make the decisions, and are comfortable saying no. Their employees do not believe they have that luxury. Whether they actually do is a psychological safety question, and another post.
That is the tension in your budget. The Blind and McKinsey numbers push you toward workload relief. The people who actually break are describing lost autonomy. A wellness week treats the first. It cannot touch the second.
What to do on a Monday?
One Indian sector already measures this properly. A 2020 meta-analysis of 3,845 healthcare workers, all on the Maslach Burnout Inventory, reports 24% high on exhaustion, 27% on depersonalisation, 23% low on accomplishment. Per dimension. A number a hospital administrator can act on. A 400-person company can do the same.
Three moves.
Ask "which ruler?" If the person quoting a figure cannot name the instrument, the sample and the cut-off, treat it as a mood.
Split the item. If your survey says "I feel burnt out", you have built the Blind ruler. Replace it with two items, exhaustion and cynicism, with a time frame ("in the last month"), reported by team. That's how our Employee Care Program reports it: by dimension, by team.
Buy by dimension. High exhaustion, low cynicism: cut demands. Low exhaustion, high cynicism: look at the manager and the autonomy they allow. Both high: both, and the manager first.
If your wellbeing report has one burnout number and nobody can say what question produced it, you do not have a burnout number. You have a count of how many people have learnt the word.
Frequently asked questions
What is the burnout rate in India?
There is no single rate. GPTW India (2026) reports 13% in a high-burnout band at companies applying for its rankings; McKinsey Health Institute (2023) found 59% above the midpoint on four symptom dimensions; a meta-analysis of Indian healthcare workers on the Maslach Burnout Inventory found about one in four high on each dimension. A figure quoted without its definition is unverified.
Is burnout a medical diagnosis?
No. ICD-11 lists it as an occupational phenomenon, defined by exhaustion, cynicism and reduced professional efficacy together, from chronic workplace stress.
How should a company measure burnout?
Use a validated instrument, ask exhaustion and cynicism as separate items with a time frame, and report by dimension and team. Exhaustion points to workload; cynicism points to missing resources, usually at the manager level.
For individuals: the therapist-written burnout guide and recognising the three dimensions in yourself.